The Coachella Valley real estate market has seen incredible changes over the past seven years. As we close out Quarter 1 of 2025, it’s the perfect time to reflect on how the market has shifted — from pricing and inventory to buyer behavior and market volume. Let’s take a look at what’s evolved and what it means for you today.
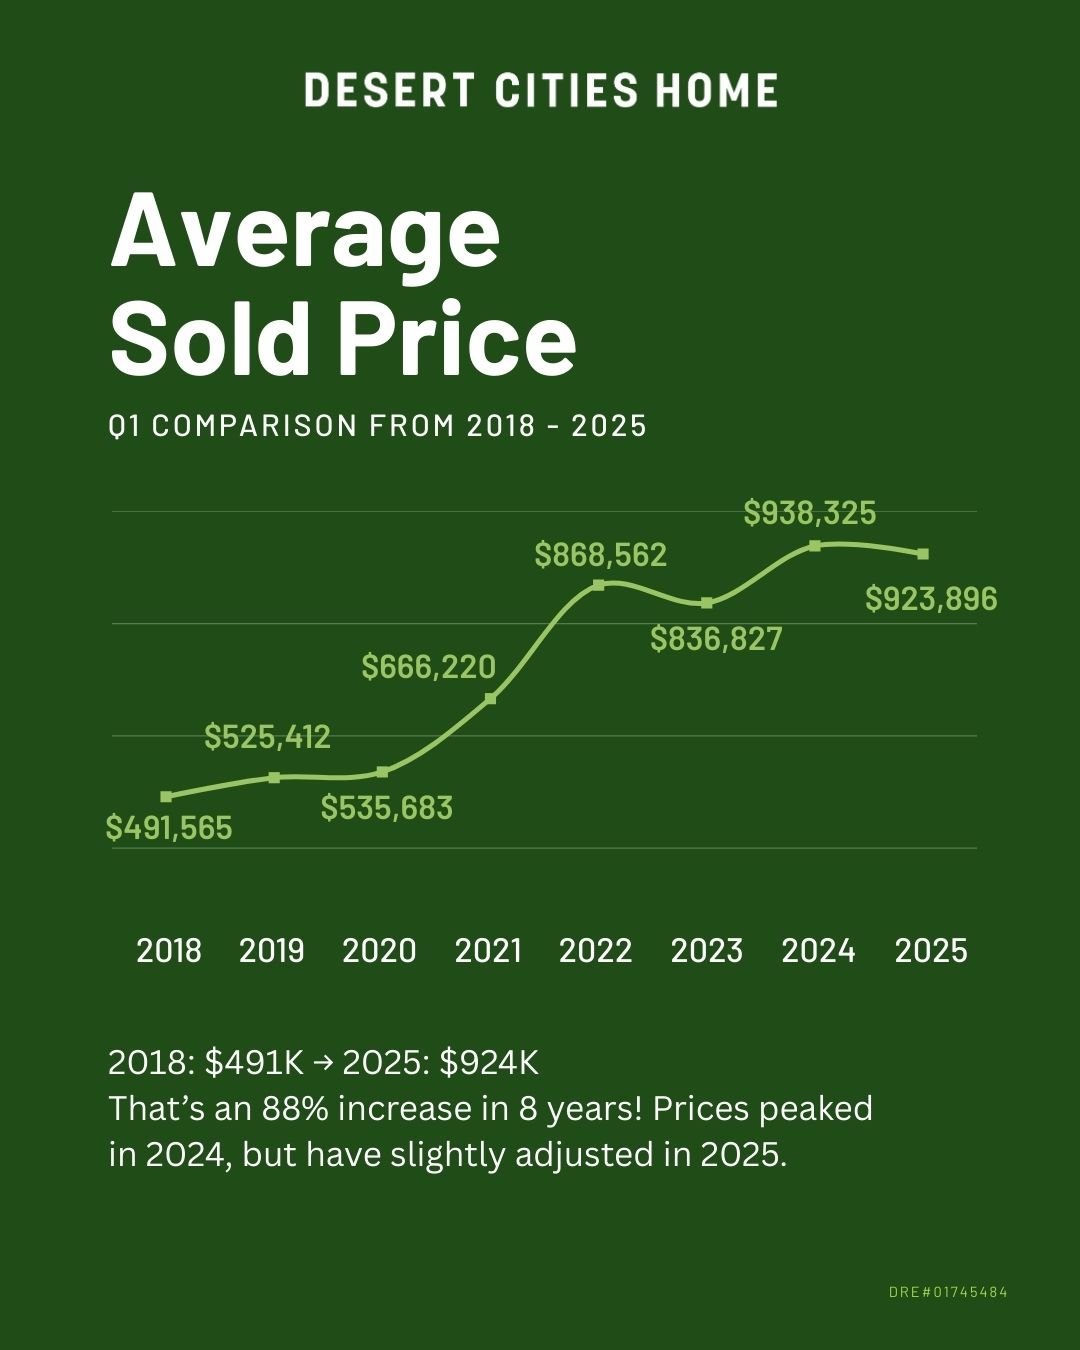
🏠 Average Sold Price: Up Nearly 90%
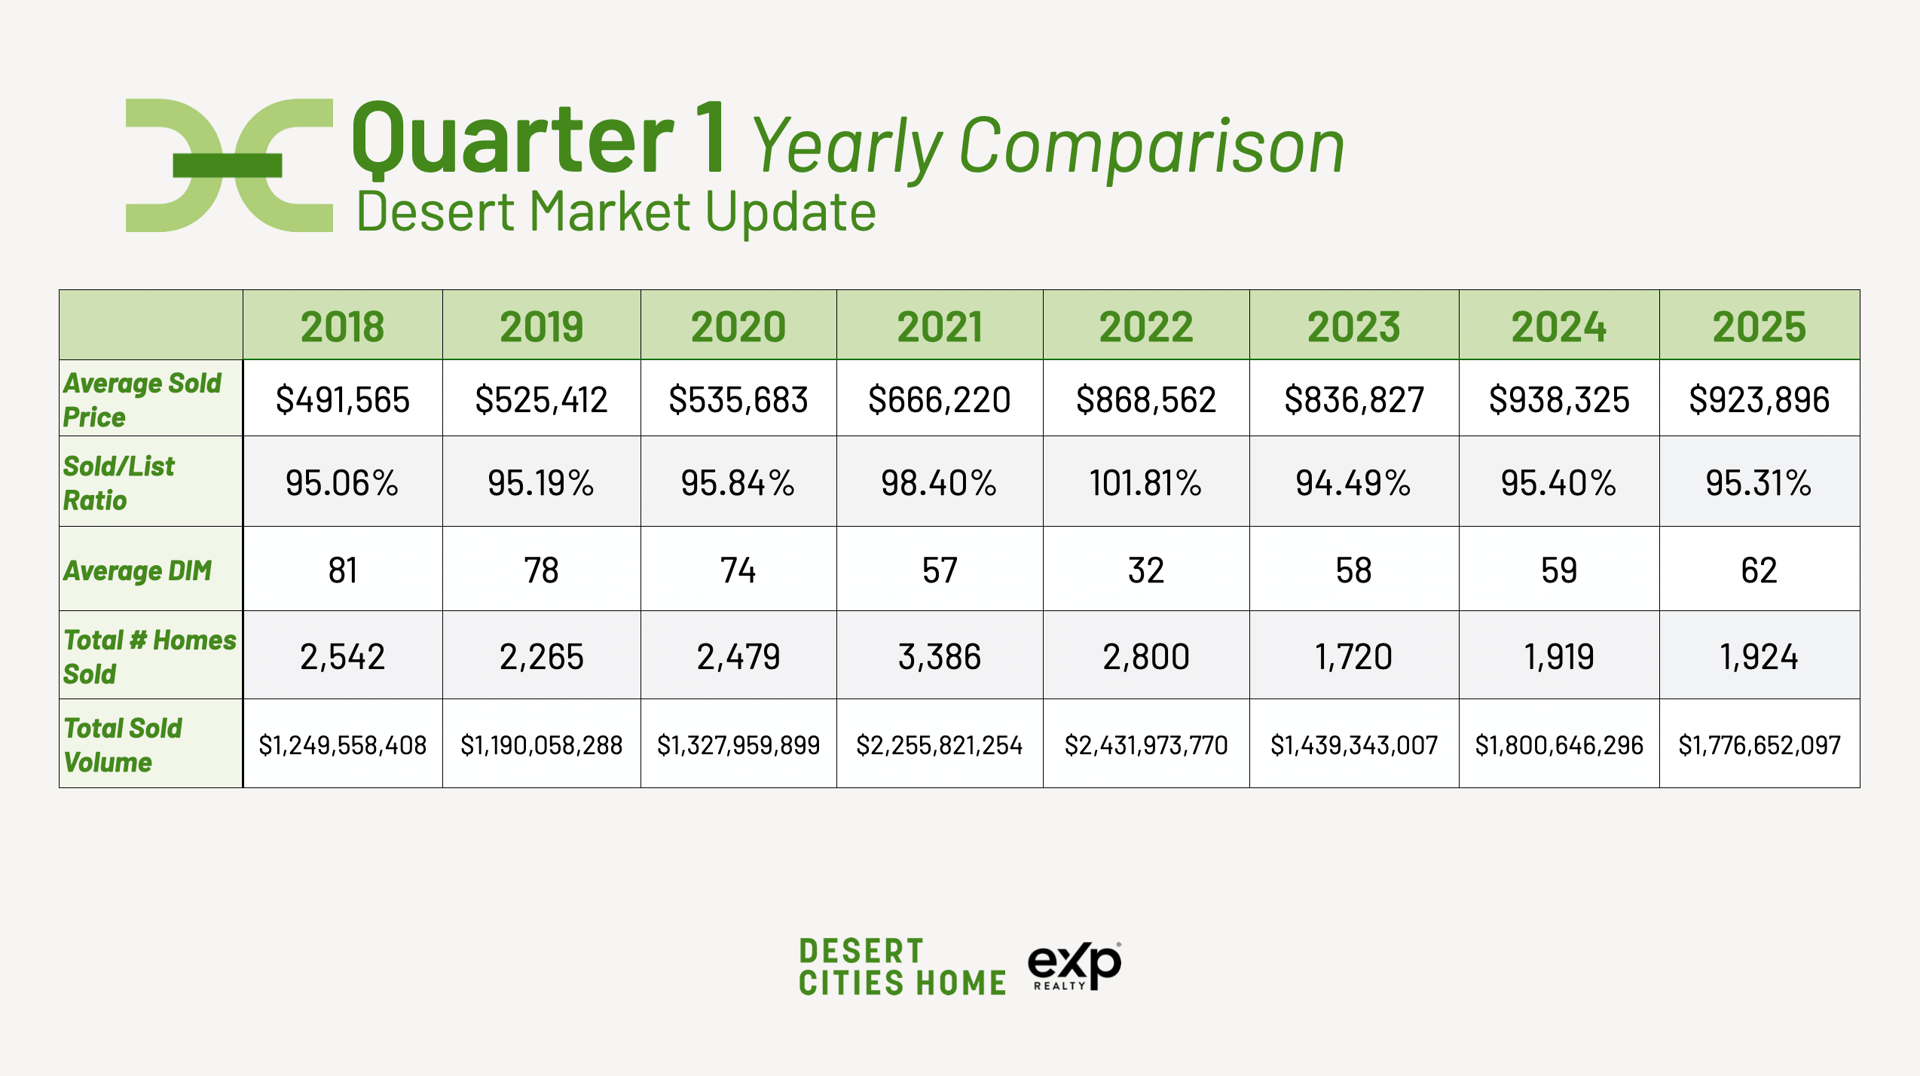
Back in Q1 of 2018, the average sold price in the desert was $491,565. Fast forward to 2025 and that number sits at $923,896 — an 88% increase in just seven years! Prices peaked in 2024, and we’re seeing a slight adjustment this year, suggesting a healthy correction.
💡 What this means:
If you purchased before 2020, you’re likely sitting on significant equity. Buyers today are still purchasing at strong price points, but with more negotiation room.
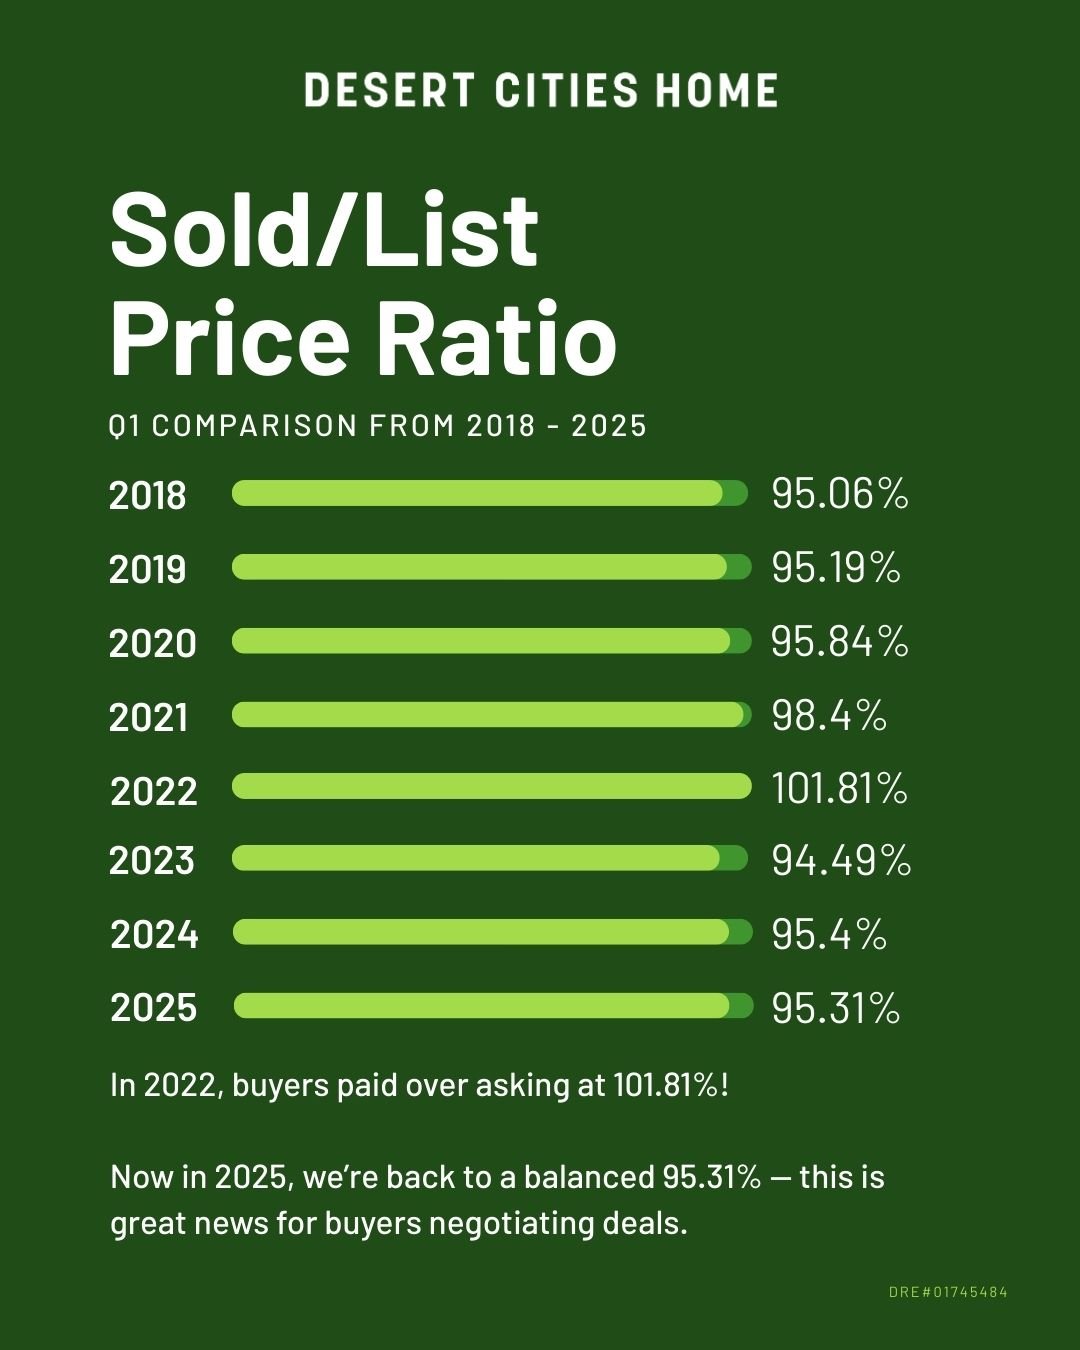
💰 Sold-to-List Price Ratio: Returning to Balance
Remember 2022? Buyers were offering well above asking — the average sold-to-list ratio was 101.81%. In 2025, we’re back to 95.31%, giving buyers more leverage in negotiations.
💡 What this means:
Bidding wars have cooled. Smart pricing and strategy matter more than ever for sellers. Buyers? You're in a better position to negotiate again.
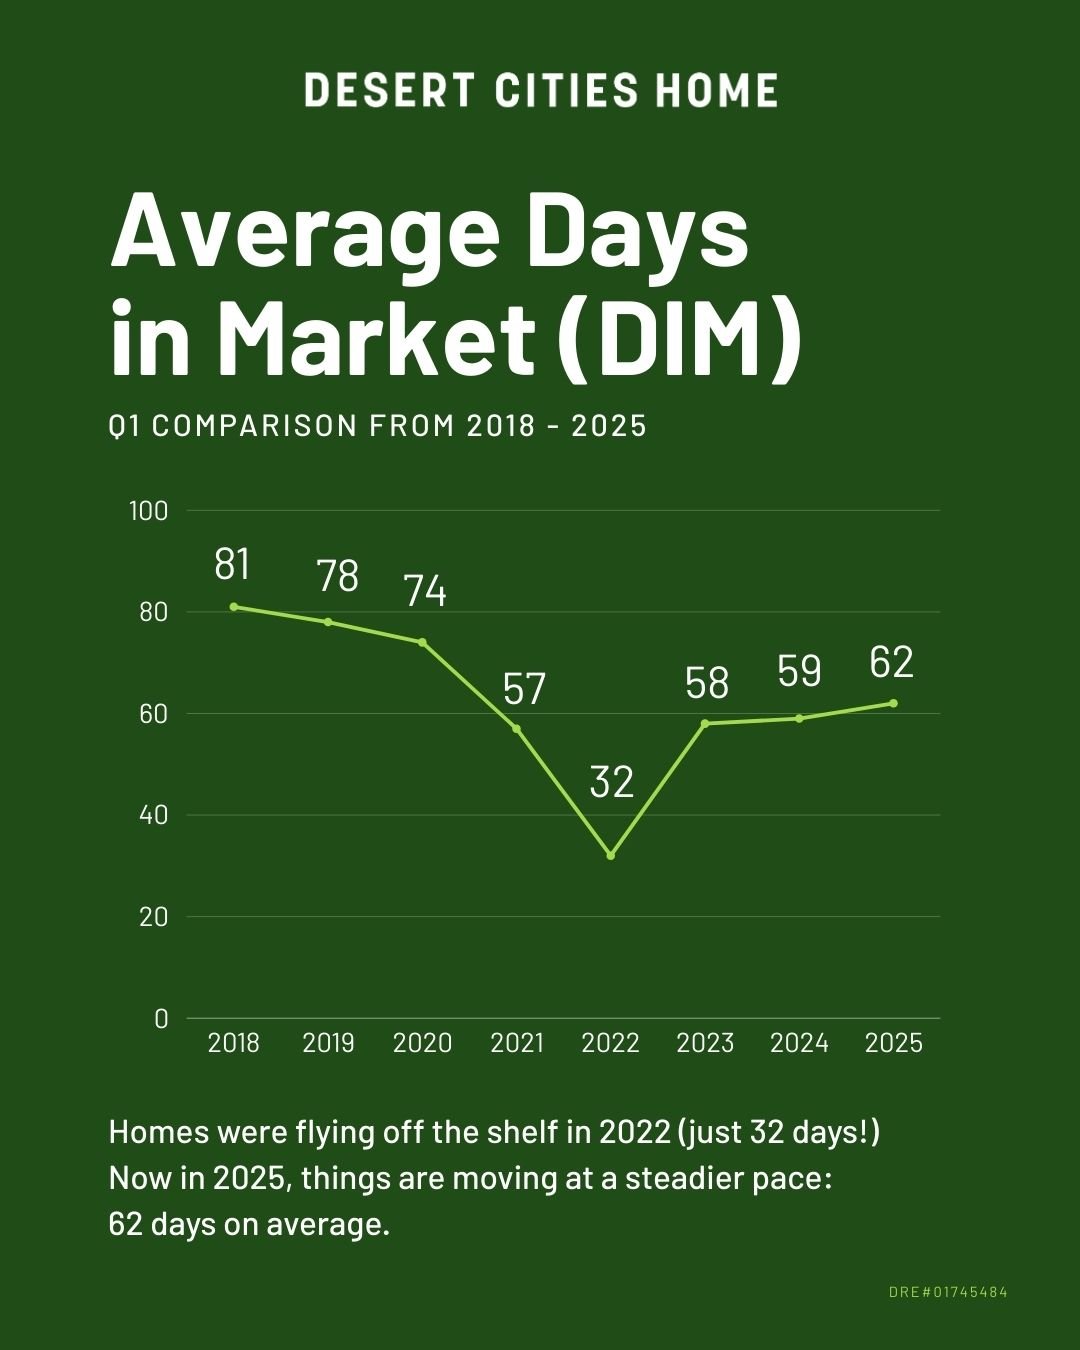
⏳ Days on Market: From Frenzy to Flow
Homes flew off the market in 2022 — averaging just 32 days! Today, homes are selling in about 62 days, offering a more sustainable pace for everyone involved.
💡 What this means:
There’s less rush, which gives buyers time to evaluate and sellers time to prepare and market their homes more thoroughly.

🏘️ Total Homes Sold: Down from Peak
The number of homes sold in Q1 peaked in 2021 at 3,386. In 2025, that number is 1,924 — a significant decrease.
💡 What this means:
Inventory remains lower, and some buyers are waiting on the sidelines due to interest rates or affordability concerns. Fewer transactions doesn’t mean less opportunity — it means the right strategy matters more.
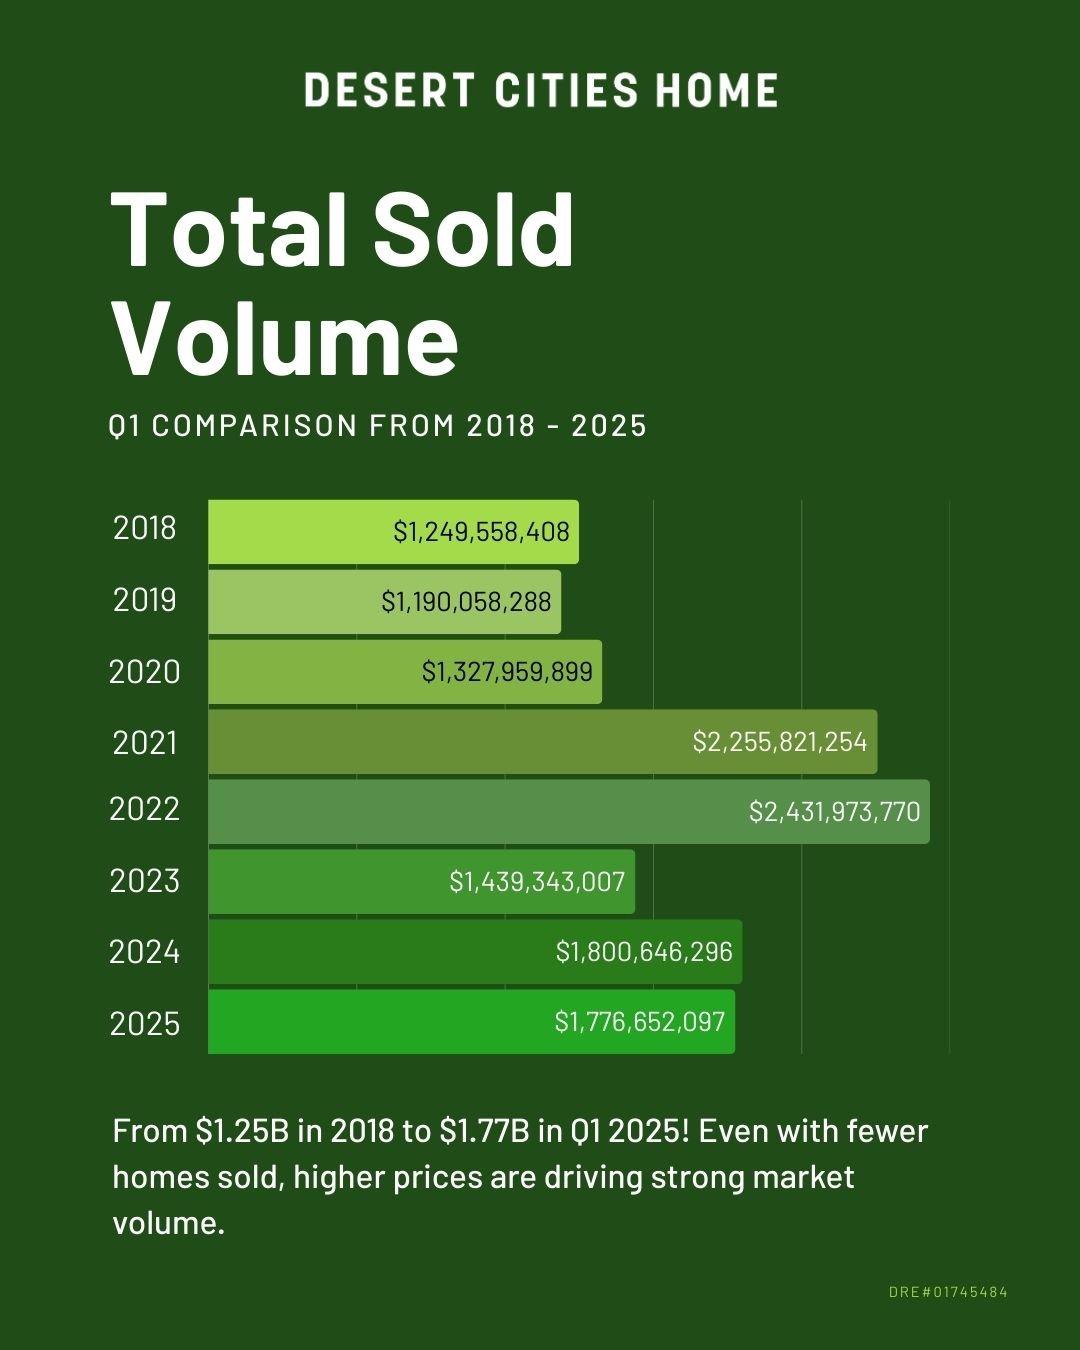
📈 Total Sold Volume: Holding Strong
Despite fewer homes being sold, total sold volume remains high. In 2025, we reached $1.77B in Q1 alone — compared to $1.25B in 2018.
💡 What this means:
High home values are driving impressive volume, even with fewer deals. The market remains robust and attractive for both long-term investment and lifestyle purchases.
🔍 Key Takeaways
✔️ Prices are still strong
✔️ Homes are taking a bit longer to sell
✔️ Buyers have more negotiating power
✔️ Inventory remains tight
✔️ Total market volume is healthy
Ready to Make a Move?
Whether you're buying or selling in the desert, understanding the trends helps you plan strategically. Let’s talk about your goals — from equity analysis to custom search alerts and local market insights, I’m here to guide you every step of the way.